
Canned reports, no analytics
Every report answers one question for one date range; nothing is trended or benchmarked. The custom builder can’t answer important questions even with an analyst. Here is where it falls short, with screenshots, and what real AdvancedMD analytics looks like.
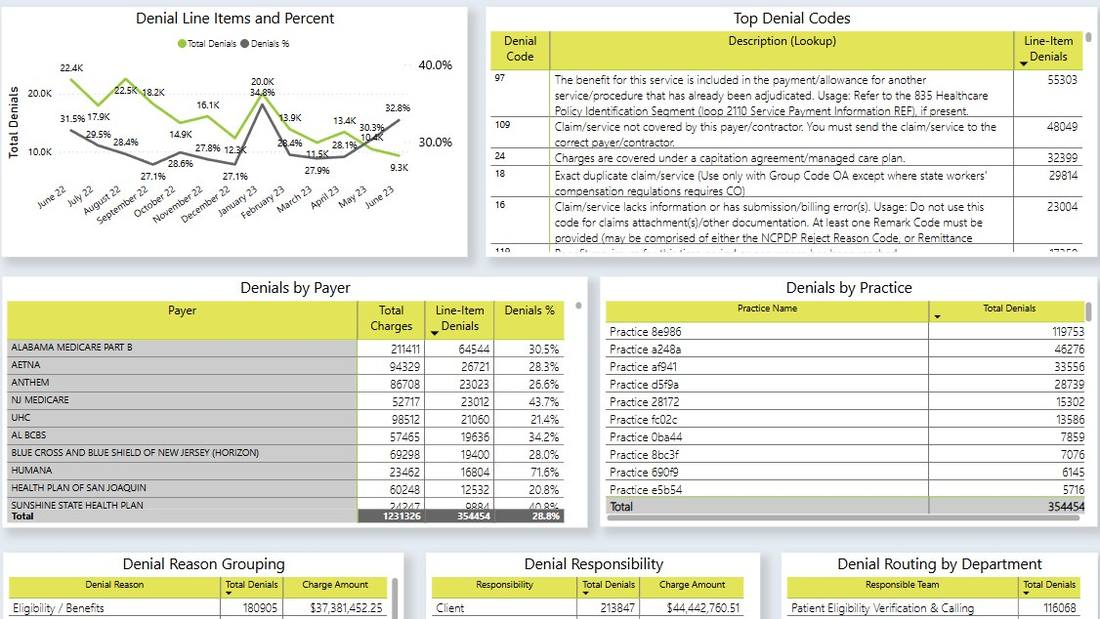
Denials Analytics for AdvancedMD: actionable intelligence by denial code, denial category, payer, CPT, ICD, and much more.
AdvancedMD has a report for almost everything. Each one is a list for a date range. These are the questions the lists don’t answer, with or without AdvancedInsight.
The Financial Dashboard shows an arrow and a sparkline per tile. Every report is a single run for a single date range. Nothing connects the two, so “why” is still a spreadsheet exercise.
Carrier Denial Analysis is a list by carrier for a date range. No trend, no denial rate by CPT × payer × provider, no way to isolate the payers driving a spike.
Denial Tracking Detail lists denials. It does not prioritize them by dollars at risk, track appeal outcomes, or tell you which ones nobody has touched.
Nothing reports productivity by biller or by function, and nothing goes beyond touches to actual results: charges posted, payments posted, claims resolved. You can’t tell a volume problem from a people problem.
The Marketing and Referral reports count referrals. Revenue per referring provider, by location, over time, means joining three exports in Excel every month.
You can see what each carrier paid. Nothing compares it to what your contract says you should have been paid, by CPT, and hands you the underpayments.
Unbilled and Held-in-Unbilled reports show what is sitting in the queue. Visits that never became a charge at all are found by comparing the schedule to charges by hand.
Net Collection Rate is a report. First-pass rate, denial rate, net collection rate and days in AR trended on one screen, against benchmarks for your specialty and payer mix, is not.
If you are a billing company with clients on their own AdvancedMD instances, there is no consolidated reporting across them – and none across AdvancedMD and the Tebra or eCW practice you also bill for.
AdvancedMD holds remittance (835) detail for a limited rolling window. After that, the line-level denial reasons for older claims are no longer in the system, so denial trends with any history cannot be built from what AdvancedMD still has.
As we wrote in How to Create Great Medical Billing Dashboards, what most vendors call “analytics” is standard reporting with a chart on top. AdvancedMD’s Financial Dashboard is a good example: it is better than most, and it still can’t answer a question.
Eight tiles – days in AR, total AR, unbilled, excluded, encounters, charges, payments, adjustments – each with a month-over-month arrow and a sparkline. It is the right idea. Then look at the numbers: Unbilled is 4, down 275%. Excluded is 1, down 600%. Percentage change on a count of four is noise dressed up as a signal, and there is nothing to click. You cannot see which payer moved AR, which provider’s charges dropped, or which claims make up the 120+ bucket on the right.
The AR chart beside it is a snapshot by aging bucket. No trend, no payer split, no comparison to last quarter. The Claims Efficiency grid is days-in-process averages with no list of the claims behind the red cells.
 Click to enlarge
The Report Center is AdvancedMD’s report menu, and it is the system’s real strength: dozens of categories, each with several reports, parameters for office keys, carrier ranges, aging buckets and four different aging dates. It is also where the time goes.
 Click to enlarge
The Report Center recommends the Missed Visits report “monthly, to generate a list for the billing staff to identify appointments that do not yet have charges posted”, to be used “as a worklist”. That is the vendor describing visit-to-claim reconciliation as a monthly manual job. In an analytics product it is a nightly exception list that empties itself.
Below it, Unbilled Claims is recommended “daily”, again as a list for a biller to work through. Daily report, daily list, daily person.
 Click to enlarge
Stop running Report Center jobs by hand. See your own data in a real dashboard in about 5 minutes.
AdvancedInsight is the custom report and dashboard builder, and it is a separate package: CPT and modifier level reporting isn’t in the base product. With an analyst you can build more – which is expensive, and most practices and billing companies don’t have one. Even with one, the questions above stay unanswered, because the data model underneath has sharp edges.
The pages in the Voyant application, connected to your AdvancedMD data. Demo data shown.
AR by payer, provider and age bucket, trended nightly. Days in AR by payer.
 Click to enlarge
Denial rate by CPT, diagnosis, payer and provider, trended, with the payers driving a spike one click away. Built from 835 remittances captured continuously at scale, parsed and normalized into Voyant’s central database, so denial history does not disappear when AdvancedMD’s window rolls over.
 Click to enlarge
Denial patterns, appeal success rates, affected claims prioritized by dollar value.
 Click to enlarge
Referral sources, marketing ROI, and your most valuable referral relationships.
 Click to enlarge
Encounters that never became claims, tracked until resolved.
 Click to enlarge
Underpayments and contract variances by payer and CPT, caught automatically.
 Click to enlarge
Charges posted, payments posted, claims worked per biller and per provider, trended. Try the free RVU calculator for the compensation math.
 Click to enlarge
First-pass, denial, net collection and days in AR, trended, with targets by specialty and payer mix.
 Click to enlarge
Worklists by age, balance, payer and denial code so nothing falls through the cracks.
 Click to enlarge
Charges, payments and AR as trends against a working-day baseline.
 Click to enlarge
| Question | AdvancedMD | Voyant AdvancedMD Analytics |
|---|---|---|
| Productivity by biller and by function, results not touches | No | Yes |
| Denial rate by CPT × payer × provider | List by carrier | Yes, with drill-down |
| Denial worklists prioritized by dollars, appeal tracking | No | Yes |
| Revenue by referral source, by location, trended | Referral counts | Yes |
| AR by payer, trended | Snapshot per run | Yes, nightly |
| Visit-to-claim reconciliation | Unbilled queue only | Automatic |
| Underpayment detection vs. your contract | No | Yes |
| KPIs trended, with benchmarks | No benchmarks | Yes |
| Clients on separate AdvancedMD instances, and other PM systems, in one view | No | Yes |
| Same claims by four date types, side by side | One per run | Yes |
| Incremental nightly refresh | Full re-extract | Yes |
Sign the HIPAA BAA and provide AdvancedMD credentials. Less than 5 minutes. No IT department required.
We extract your historical data. Typically 3–5 days depending on size, due to AdvancedMD system limitations.
Data updates automatically – every night, or in real time, depending on your needs. You keep using AdvancedMD for billing exactly as today.
Our founders built and sold a large national medical billing company. Every feature solves a problem we lived with.
Your denial rate spiked; here are the 2 payers causing it, the procedures, and the claims to work.
No AdvancedMD fees, no clearinghouse contracts. We extract the data you’re entitled to without vendor cooperation.
Already built and proven. Extract your history and you’re running in days, not months.
We use AI to flag anomalies, classify denials and surface what to work next. It works because the data underneath is clean and structured first; that is the part most RCM AI projects skip.
Several AdvancedMD office keys, or AdvancedMD plus Tebra, eClinicalWorks or any other PM system, in one dashboard.
Connect AdvancedMD in 5 minutes. Free 30-day trial, nothing charged until day 31.
Yes. We work with current AdvancedMD PM instances, with or without AdvancedInsight, and across any number of office keys. If you have an unusual configuration, book a call and we’ll confirm.
No. We extract the data you already have access to by connecting directly to your system. No API license, no AdvancedInsight subscription, no vendor cooperation, no clearinghouse contract.
Yes. Any number of keys and systems roll into one reporting platform. This is especially useful for billing companies with clients on several systems, and practices with multiple EHRs or a legacy system that want to keep data integrity.
Onboarding takes less than 5 minutes. Historical data extraction typically takes 3–5 days depending on size. Once live, data updates every night, or we have a real-time option.
We are fully HIPAA compliant and keep all data strictly confidential. We never sell your data.
No. You keep using AdvancedMD for billing exactly as you do today. Voyant is the analytics layer on top, and can also provide opportunities for improved workflow. Talk to us to learn about our Workflow module or automation tools.
Pricing depends on the number of providers and systems, and whether you are a practice or a billing company. Every plan includes a free 30-day trial and a 30-day money-back guarantee. Book a call for full pricing.
Yes. No long-term contracts, cancel anytime, and a 30-day money-back guarantee.
Also for Tebra / Kareo users: Tebra dashboard. eClinicalWorks users: eCW reporting. Other systems: RCM analytics.